The 50/30/20 Budget Rule Explained (With a Real Household Example)

Last verified: September 2026.
The 50/30/20 rule is the simplest budgeting framework most people will ever use: take-home pay is split into three buckets, with 50% for needs, 30% for wants, and 20% for savings and debt payoff. It needs no tracking of individual categories, which is both its main appeal and its main weakness. This guide explains where the rule comes from, walks through a full household example with every line adding up, and shows how to adjust the split when the standard numbers do not fit, as they often do not in high-cost areas.
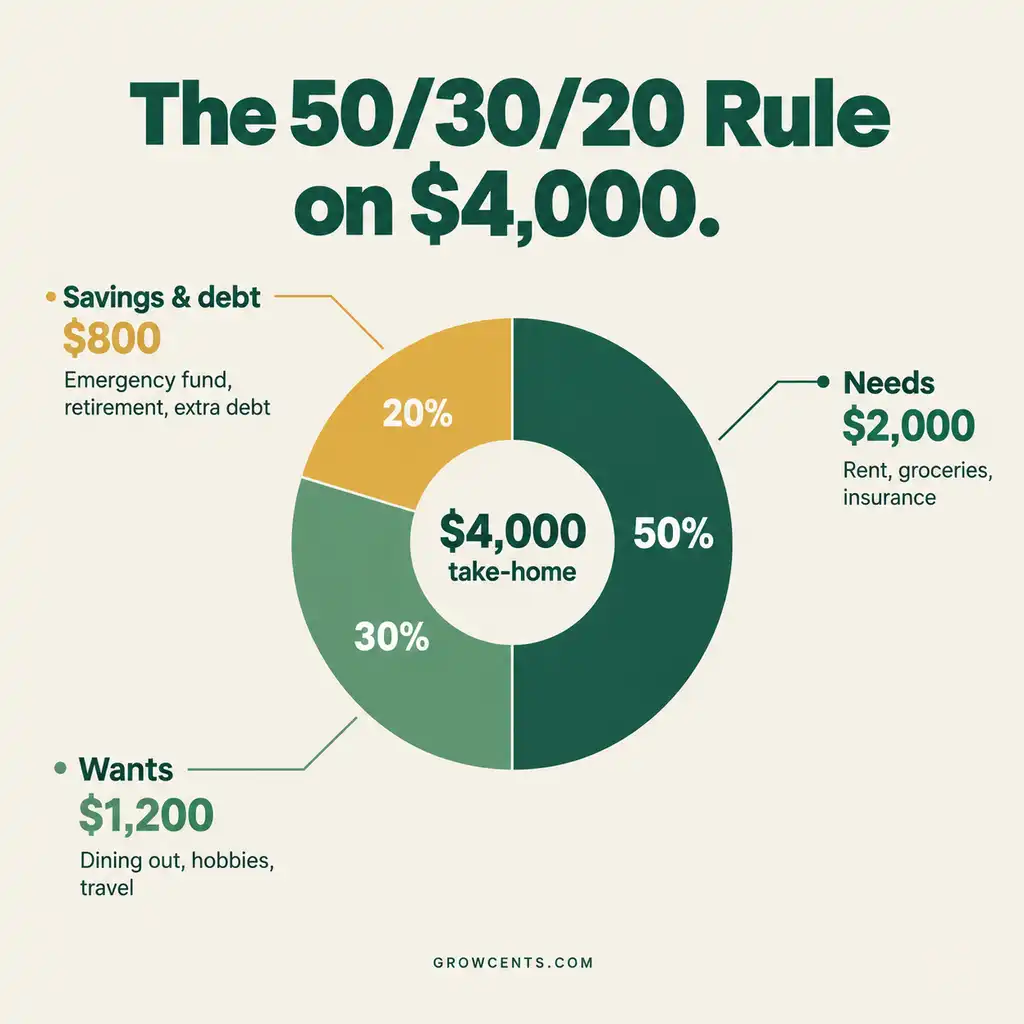
Quick Answer: The 50/30/20 rule divides after-tax income into 50% for needs (housing, utilities, groceries, transportation, insurance, and minimum debt payments), 30% for wants (dining out, entertainment, hobbies, and non-essential shopping), and 20% for savings and extra debt payments. On $4,000 of monthly take-home pay, that is $2,000, $1,200, and $800. The percentages are guidelines rather than laws, and many households adjust them, usually by trimming wants to protect the savings share when needs run above 50%.
Where the 50/30/20 Rule Comes From
The rule comes from All Your Worth: The Ultimate Lifetime Money Plan, a 2005 book by Elizabeth Warren and her daughter Amelia Warren Tyagi, where it is called the balanced money formula. In a 2005 interview with the authors republished on FoxNews.com, the plan is laid out this way: start with the must-haves, aim for 50% of take-home pay, then 30% for wants and 20% for savings. The interview describes must-haves as the bills that come due month after month no matter what, such as rent or a mortgage, insurance, and car payments. Two details are easy to miss. The percentages apply to take-home pay, not gross salary, and the plan gives wants their own 30% instead of treating fun spending as something to eliminate, which is part of what keeps a budget livable.
What Counts in Each Bucket
| Bucket | Share of Take-Home Pay | What Typically Goes Here |
|---|---|---|
| Needs | 50% | Rent or mortgage, utilities, basic groceries, transportation to work, insurance, minimum debt payments, essential health care |
| Wants | 30% | Dining out, streaming and other subscriptions, entertainment, travel, hobbies, non-essential shopping |
| Savings and debt | 20% | Emergency fund contributions, retirement savings, extra payments beyond minimums, sinking funds for irregular costs |
The line between a need and a want is where most of the effort goes. Groceries are a need; the portion of the food bill spent on restaurants and delivery is a want. A phone is a need; the newest model is a want. A useful test is whether the bill would still have to be paid if income stopped for a month.
A Full Household Example: $4,000 in Take-Home Pay
The table below shows one way a household with $4,000 of monthly take-home pay could fill each bucket. The categories are illustrative, not recommendations, and every subtotal matches the 50/30/20 target exactly.
| Bucket | Line Item | Amount |
|---|---|---|
| Needs | Rent | $1,000 |
| Needs | Utilities, phone, and internet | $200 |
| Needs | Groceries | $400 |
| Needs | Transportation | $250 |
| Needs | Insurance and essential health costs | $100 |
| Needs | Minimum debt payments | $50 |
| Needs subtotal (50%) | $2,000 | |
| Wants | Dining out and takeout | $250 |
| Wants | Subscriptions and entertainment | $100 |
| Wants | Clothing and shopping | $200 |
| Wants | Hobbies | $150 |
| Wants | Travel fund | $300 |
| Wants | Gifts and miscellaneous | $200 |
| Wants subtotal (30%) | $1,200 | |
| Savings and debt | Emergency fund | $300 |
| Savings and debt | Retirement savings | $200 |
| Savings and debt | Extra debt payment | $200 |
| Savings and debt | Sinking funds (irregular costs) | $100 |
| Savings and debt subtotal (20%) | $800 | |
| Total | $4,000 |
The 50/30/20 Split on $4,000 — Infographic
What 50/30/20 Looks Like at Different Incomes
| Monthly Take-Home Pay | Needs (50%) | Wants (30%) | Savings and Debt (20%) |
|---|---|---|---|
| $3,000 | $1,500 | $900 | $600 |
| $4,000 | $2,000 | $1,200 | $800 |
| $5,000 | $2,500 | $1,500 | $1,000 |
| $6,000 | $3,000 | $1,800 | $1,200 |
When 50% for Needs Is Not Realistic
For many households, the needs bucket does not fit in half of take-home pay. The U.S. Bureau of Labor Statistics reports in its 2024 Consumer Expenditure Survey that the average household spent $2,189 a month on housing and $1,110 a month on transportation, which together accounted for over 50 percent of total household spending. Those two categories alone come to $3,299 a month. For that amount to fit inside a 50% needs bucket, take-home pay would have to be about $6,600 a month, before counting food, health care, or insurance. National averages blend very different households, so this is an illustration of how tight the 50% line can be, not a verdict on any one budget.
InCharge Debt Solutions, a nonprofit credit counseling agency, makes the same practical point in its overview of the rule: the 50/30/20 split can be difficult, if not unrealistic, for lower-income households. The rule is a starting framework, and adjusting it is expected rather than a failure.
Adjusting the Split
| Monthly Take-Home Pay | Needs (50%) | Wants (30%) | Savings and Debt (20%) |
|---|---|---|---|
| $3,000 | $1,500 | $900 | $600 |
| $4,000 | $2,000 | $1,200 | $800 |
| $5,000 | $2,500 | $1,500 | $1,000 |
| $6,000 | $3,000 | $1,800 | $1,200 |
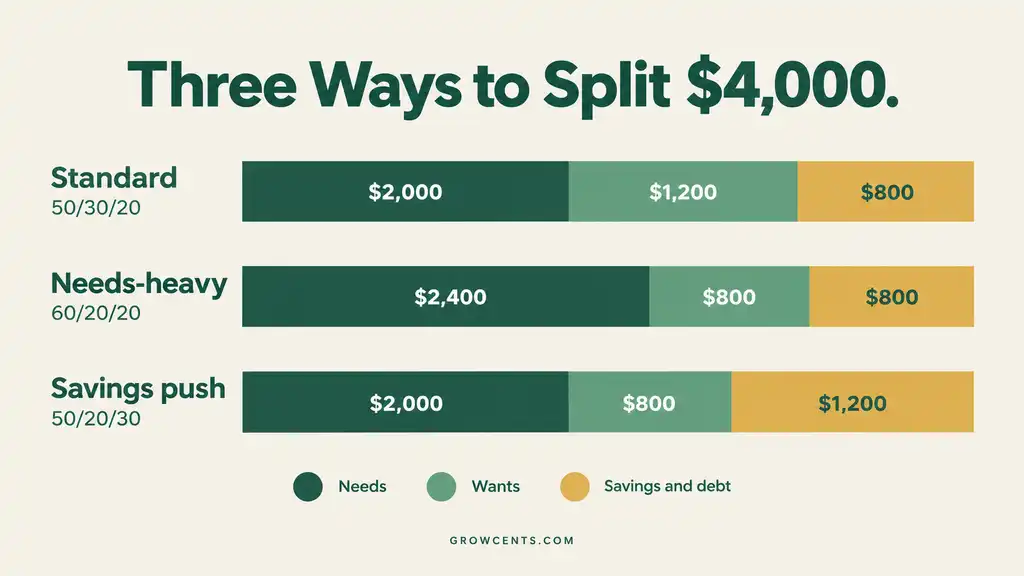
These variations are common adaptations, not official versions. The pattern in all of them is the same: when one bucket grows, another has to shrink, and wants usually shrink first because needs are harder to change quickly.
Three Ways to Split $4,000 — Infographic
How to Set Up a 50/30/20 Budget
- Find take-home pay. Use what actually lands in the bank each month, as in the household budgeting guide. If retirement contributions come out of the paycheck before it arrives, one consistent approach is to add them back to the take-home figure and count them toward the 20%.
- Calculate the three targets. Multiply take-home pay by 0.50, 0.30, and 0.20.
- Sort last month’s spending into the three buckets. The first pass shows where reality differs from the targets.
- Adjust. If needs are over 50%, decide whether to trim wants, change the split, or reduce a large need over time.
- Automate the 20%. A recurring transfer on payday, as covered in the guide to automating savings, makes the savings share happen before the wants bucket can absorb it.
- Review monthly. Because the method uses broad buckets, a quick monthly check of the three totals is usually enough.
How It Compares With Zero-Based Budgeting
The 50/30/20 rule sets three broad targets, while a zero-based budget assigns every dollar to a specific category. The two work well together: 50/30/20 can decide how large each group should be, and a zero-based plan can then assign each dollar inside the groups. Households that find a full zero-based plan too time-consuming often prefer the lighter-touch 50/30/20 structure.
Strengths and Limits
- Strength: simplicity. Three numbers are easy to remember and apply, even without detailed tracking.
- Strength: it includes fun. Building wants into the plan makes a budget easier to keep.
- Limit: fixed percentages ignore local costs. A household in a high-rent area and one in a low-cost area face very different needs shares.
- Limit: 20% may not be enough for everyone. Veterans United’s summary of the formula notes the common criticism that 20% may fall short, particularly for retirement, and that people closer to retirement may need to save more.
- Limit: irregular income. Percentages of an uneven paycheck move around, so many people apply them to the lowest typical month.
Common Mistakes
- Applying the percentages to gross pay. The rule is built on take-home pay, so using the pre-tax figure overstates every bucket.
- Calling wants “needs.” A premium phone plan or a large grocery-and-dining bill can quietly inflate the needs bucket.
- Forgetting irregular expenses. Annual costs need a home inside the 20% through a sinking fund tracker or they show up as surprises.
- Treating the percentages as pass/fail. Landing at 55/25/20 is still a plan, and closing the gap gradually is normal.
- Skipping the emergency fund. Part of the 20% should go to a starter emergency fund before other goals.
Frequently Asked Questions
Is the 50/30/20 rule based on gross or net income?
Net, meaning take-home pay after taxes and payroll deductions. Applying it to gross pay would put every bucket too high.
Do minimum debt payments count as needs or savings?
Most explanations count minimum payments as needs because they must be paid, and count extra payments beyond the minimum toward the 20% savings and debt share. Some versions group all debt payments in the 20%, so the key is choosing one approach and sticking with it.
What if needs are more than 50%?
Many households adjust the split, for example to 60/20/20 by trimming wants, or look for ways to lower a large need over time. The rule is a guide, not a requirement.
Where do retirement contributions fit?
They count toward the 20% savings share, including contributions taken out of the paycheck before it lands in the bank.
Is 50/30/20 better than zero-based budgeting?
Neither is better for everyone. 50/30/20 is simpler and lighter on tracking, while zero-based budgeting gives tighter control. Some people start with 50/30/20 and move to a more detailed plan later.
How This Guide Was Built
This guide was researched using the authors’ own description of the rule, government spending data, and consumer education sources rather than personal anecdote or invented statistics. The origin and definitions come from a 2005 interview with the authors of All Your Worth. Household spending figures come from the Bureau of Labor Statistics’ 2024 Consumer Expenditure Survey summary. The limitations come from InCharge Debt Solutions and Veterans United. The general budgeting steps reference the FTC’s consumer.gov budgeting guide. The household example and all dollar splits are illustrations built for this guide, calculated directly and not sourced data. The $6,600 figure is arithmetic on the BLS averages ($3,299 divided by 0.50). GrowCents’ full research and sourcing approach is described on the Editorial Policy page and the About page.
This article is general educational information, not personalized financial advice, and does not account for any individual household’s full financial situation. See the Disclaimer page for details.