
How to Build Your Own Budget Spreadsheet From Scratch

Last verified: September 2026.
A budget spreadsheet built from scratch costs nothing beyond the time to set it up, and it can be customized exactly to a household’s own categories rather than forced into whatever structure a free app happens to offer. This guide walks through building one step by step in Google Sheets (the same steps work almost identically in Excel): the tabs to create, the formulas that do the math automatically, and the formatting that flags overspending without any manual checking.
Quick Answer: A working budget spreadsheet needs at minimum three tabs — Income, Expenses, and a Summary — with a
SUMformula totaling each category, aSUMIFformula pulling actual spending by category from a transaction log, and conditional formatting that highlights any category where actual spending exceeds the planned amount. Everything else (extra tabs, charts, colors) is optional on top of that core structure.
What the Spreadsheet Actually Needs to Do
Before building anything, it helps to be clear about the job the spreadsheet is doing: recording planned amounts per category, recording what was actually spent, and showing the difference without manual recalculation every time a new expense is entered. Everything built in the steps below serves one of those three purposes.
Step 1: Set Up the Tabs
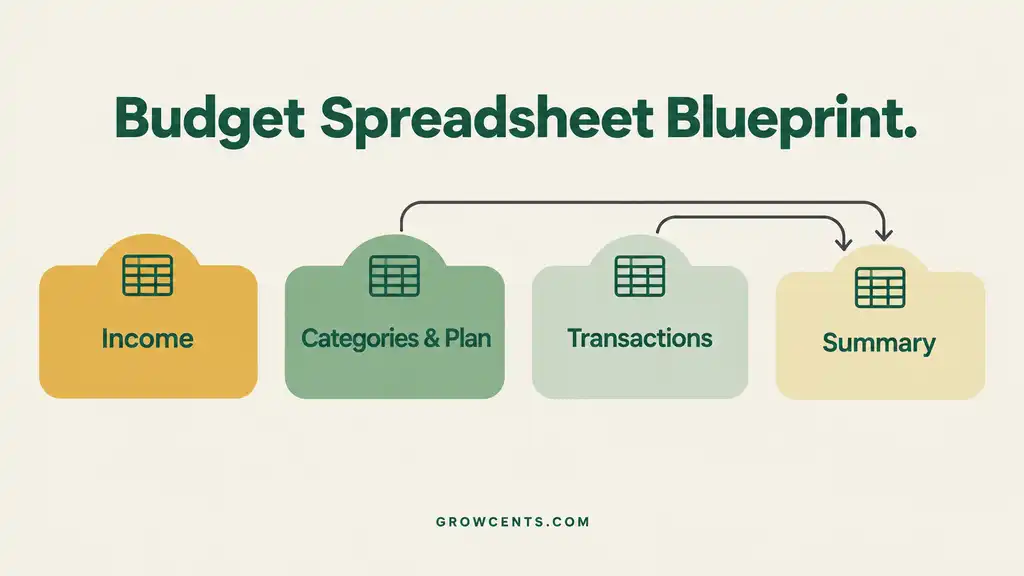
A simple, reliable structure uses four tabs:
| Tab | Purpose |
|---|---|
| Income | Every source of income for the month, with the amount and expected date |
| Categories & Plan | Every budget category with its planned monthly amount, based on the household’s budgeting steps |
| Transactions | A running log of every expense as it happens, each tagged with a category |
| Summary | A dashboard pulling totals from the other tabs to show planned vs. actual spending at a glance |
Keeping the transaction log separate from the category plan is the detail that makes the rest of the spreadsheet work: the plan stays fixed for the month, while new rows are simply added to the Transactions tab as spending happens, and the formulas below do the matching automatically.
Step 2: Build the Category List with a Dropdown
On the Categories & Plan tab, list every category in one column with its planned amount beside it. Then, on the Transactions tab, use that category list to create a dropdown for the category column, so every transaction gets tagged consistently rather than typed freehand (which causes “Groceries” and “groceries” to be counted separately later). Google’s own documentation on creating an in-cell dropdown list covers the exact steps: select the cell range, open Data validation, and choose the category list as the source range.
Step 3: Add the Core Formulas
Two formulas do almost all of the work in a spreadsheet like this:
- Total income:
=SUM(Income!B2:B20)adds every income amount listed on the Income tab. - Actual spending by category:
=SUMIF(Transactions!C:C, "Groceries", Transactions!B:B)totals every transaction tagged “Groceries” in the category column, pulling the matching amounts from the amount column. Repeating this formula once per category, on the Summary tab, builds the full actual-spending picture automatically as new transactions are added.
According to Google’s own reference documentation, the SUMIF function returns a conditional sum across a range based on a single criterion, which is exactly the “sum this category” behavior needed here. For a household that wants to filter by more than one condition at once (a category and a specific month, for example), the related SUMIFS function extends the same idea to multiple criteria.
Budget Spreadsheet Blueprint — Infographic
Step 4: Flag Overspending Automatically
On the Summary tab, once a planned amount and an actual amount sit side by side for each category, conditional formatting can highlight any row where actual spending has passed the plan. Google’s documentation on conditional formatting rules describes setting this up with a custom formula rule, such as =C2>B2 (where column B holds the planned amount and column C holds the actual amount), applied to the row range and set to change the cell’s background color when true. Once set up, an overspent category turns a visible color the moment a new transaction pushes it over the limit, with no manual checking required.
Step 5: Build the Summary Dashboard
The Summary tab pulls everything together in one place: category name, planned amount, actual amount (via the SUMIF formulas from Step 3), and the difference between them (a simple subtraction formula). A final row totaling both columns shows whether total spending is on track against total income for the month. Keeping this tab visually simple — one row per category, no extra clutter — is usually more useful than adding charts right away; a chart can always be added later once the underlying numbers are reliable.
Keeping It Updated Each Month
At the start of each new month, clearing (not deleting the formulas from) the Transactions tab and resetting any planned amounts that changed keeps the spreadsheet accurate without rebuilding it from scratch. Many people duplicate the entire spreadsheet file month to month instead, which preserves a full history of past months for comparison over time.
Common Mistakes
- Typing categories freehand instead of using a dropdown. Inconsistent spelling breaks the SUMIF formulas, since “Groceries” and “groceries ” (with a trailing space) are treated as different text.
- Mixing planning and tracking in the same tab. Keeping the fixed monthly plan separate from the growing transaction log is what allows new expenses to be added without disturbing the budget numbers.
- Building the whole system before testing it with real numbers. Testing each formula with a few sample transactions before fully building out every category catches formula errors early, when they are easy to fix.
- Making the summary too complex too soon. A few extra charts and color-coded sections can wait until the basic planned-vs-actual structure is already working reliably.
Frequently Asked Questions
Does this work the same way in Excel as in Google Sheets?
The formulas (SUM, SUMIF, conditional formatting) work almost identically in both programs, though the menu steps for data validation and conditional formatting are accessed slightly differently in Excel’s ribbon interface compared to Google Sheets’ Data and Format menus.
How many categories is too many?
There is no fixed limit, but a category list long enough that it becomes tedious to tag every transaction usually works against the goal; starting with 8 to 12 broad categories and splitting one further only if it proves genuinely useful tends to work better than starting with 30 narrow ones.
Can this spreadsheet track multiple bank accounts?
Yes, by adding an account column to the Transactions tab and, if needed, a SUMIF formula on the Summary tab filtered by account instead of (or in addition to) category.
Is a template faster than building one from scratch?
A template can save setup time, but a spreadsheet built from scratch is easier to fully understand and modify later, since every formula and tab exists for a specific, known reason rather than being inherited from someone else’s structure.
What if a formula returns an error?
Most errors in a SUMIF setup come from a mismatched range size between the criteria range and the sum range, or a category name that does not exactly match the dropdown list; checking both of these first resolves the majority of formula errors.
How This Guide Was Built
This guide was researched using official product documentation rather than personal anecdote or invented statistics. The dropdown and data validation steps reference Google’s own documentation on creating an in-cell dropdown list. The formula behavior described for SUMIF comes from Google’s official function reference. The conditional formatting steps reference Google’s documentation on conditional formatting rules. Category examples reference GrowCents’ own household budgeting guide. GrowCents’ full research and sourcing approach is described on the Editorial Policy page and the About page.
This article is general educational information, not personalized financial or technical advice, and spreadsheet software features may change over time. See the Disclaimer page for details.



One Comment
Comments are closed.