
How Much Should You Have in Savings at Every Age? (What the Data Shows)

Last verified: September 2026.
National savings data by age is easy to find and easy to misread. This guide walks through what the most recent government data actually shows, why the “average” figure usually paints a misleading picture, and why a national number is a poor substitute for a savings goal based on an individual household’s own expenses.
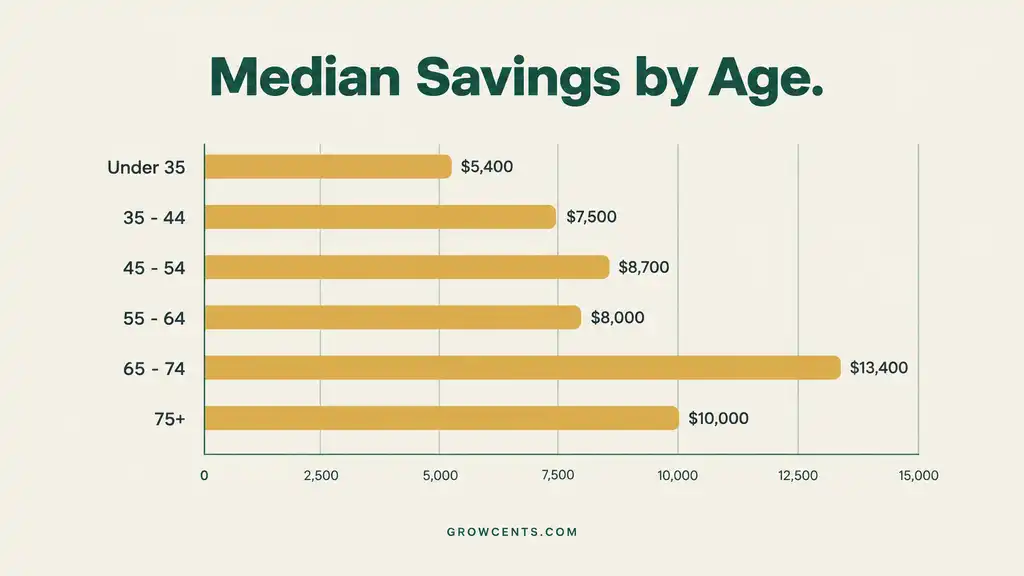
Quick Answer: According to the Federal Reserve’s 2022 Survey of Consumer Finances, the median transaction account balance (checking, savings, and money market combined) ranges from $5,400 for households under 35 to $13,400 for households aged 65 to 74. These figures reflect everyday cash accounts only, not retirement accounts or investments, and they vary enormously by income, location, and family circumstances. A more useful personal benchmark is months of expenses covered, not a comparison to a national figure.
What This Data Actually Measures
The numbers in this guide come from “transaction accounts,” which the Federal Reserve defines as checking, savings, money market accounts, and similar accounts people can access relatively easily. This figure does not include retirement accounts like a 401(k) or IRA, investment accounts, or home equity, so it understates a household’s total financial position. It is best read as a snapshot of accessible cash specifically, which is also the figure most relevant to an emergency fund conversation.
Median and Average Savings by Age
| Age of Household | Median Balance | Average (Mean) Balance |
|---|---|---|
| Under 35 | $5,400 | $20,540 |
| 35–44 | $7,500 | $41,540 |
| 45–54 | $8,700 | $71,130 |
| 55–64 | $8,000 | $72,520 |
| 65–74 | $13,400 | $100,250 |
| 75 and older | $10,000 | $82,800 |
Data: Federal Reserve 2022 Survey of Consumer Finances, the most recent edition available as of this writing. These figures reflect transaction account balances only, not total household wealth.
Why the Median Matters More Than the Average
Notice how much larger the average (mean) balance is than the median at every age — sometimes four or five times larger. That gap exists because a relatively small number of households with very high balances pull the average far above what a typical household actually holds. The median, which represents the household exactly in the middle of the distribution, is a far more realistic picture of what most people in a given age group actually have on hand. Any “average savings” figure quoted without mentioning the median is worth treating with some skepticism.
Median Savings by Age — Infographic
A More Useful Benchmark: Months of Expenses, Not a National Number
A national median is calculated across households with wildly different costs of living, family sizes, and income levels, which makes it a poor personal target. A more actionable benchmark is the number of months of essential expenses a household’s own savings would cover, which is the framework covered in the guide to starting an emergency fund when money is tight: a $500–$1,000 starter goal, then one month, then three, then six, calculated from that specific household’s own expenses rather than a national average.
What If a Household’s Savings Are Below the Median for Its Age
Being below the median for an age group is, by definition, something roughly half of all households experience, and it reflects a wide range of ordinary circumstances: a recent move, a career change, a period of paying down debt, a lower-cost-of-living area with correspondingly different savings norms, or simply having started saving later. The more useful question is not “how does this compare to the median” but “what is the realistic next step toward this household’s own savings goal,” which a starter emergency fund approach answers directly.
Factors That Explain the Wide Variation
- Income. The same Federal Reserve data shows a median transaction account balance of $900 for the lowest income group, compared to $111,600 for the highest, reflecting how directly savings capacity is tied to income level.
- Cost of living. A household in a high-cost metro area and a household in a lower-cost region can have identical savings discipline and very different account balances.
- Family structure. The same data shows savings levels differing notably between single-income, dual-income, and single-parent households.
- Historical and structural factors. The Federal Reserve’s data also shows persistent differences in median savings across racial and ethnic groups, reflecting long-running disparities in income, inherited wealth, and access to financial services rather than differences in financial behavior.
Common Mistakes When Comparing Savings to a National Figure
- Using the average instead of the median. The average is skewed upward by a small number of very high balances and does not represent a typical household.
- Comparing accessible cash to total net worth. These transaction-account figures exclude retirement accounts, home equity, and investments, so they understate a household’s full financial position.
- Treating the median as a required minimum. A national median is a description of what exists, not a standard anyone is failing to meet.
- Letting a comparison replace a plan. A specific, personal savings goal based on actual monthly expenses is more useful than any comparison to a national or age-based figure.
Frequently Asked Questions
Does this data include retirement accounts?
No; these figures cover checking, savings, and money market accounts only. Retirement account balances are tracked separately in the same Federal Reserve survey and are not included here.
Why is the 55–64 median lower than the 45–54 median?
This specific pattern appears in the Federal Reserve’s own data and is one of a few exceptions to the general trend of savings rising with age; the survey does not attribute a single definitive cause, though the years leading up to and following typical retirement can involve larger, planned drawdowns from accessible accounts.
Is it normal to have little or nothing in savings at any age?
It is common; a meaningful share of households at every age report having little in accessible savings, which is part of why building toward even a modest starter emergency fund is worth doing regardless of age or past saving history.
How often is this Federal Reserve data updated?
The Survey of Consumer Finances is conducted every three years; the 2022 edition was the most recent published as of this writing, with the next survey’s results expected at a later date.
Should this data change how much a household tries to save each month?
Not directly; the more useful inputs are a household’s own expenses, income, and goals, as covered in the household budgeting guide, rather than a national age-based figure.
How This Guide Was Built
This guide was researched using official government survey data rather than personal anecdote or invented statistics. All balance figures come from the Federal Reserve’s 2022 Survey of Consumer Finances, the most comprehensive and recent government study of U.S. household finances available as of this writing. GrowCents’ full research and sourcing approach is described on the Editorial Policy page and the About page.
This article is general educational information, not personalized financial advice, and national or age-based averages do not reflect any individual household’s circumstances. See the Disclaimer page for details.