How to Track Your Spending for 30 Days (With a Simple Printable Tracker)
Last verified: September 2026.
Most people have a rough idea of what they spend on rent and utilities and a much fuzzier idea of everything else. Tracking spending for 30 days closes that gap. It does not require a budget, an app, or any change in behavior; it only requires writing down what actually happens. This guide explains why a full month is the right length, shows a simple tracker with a worked example, and covers how to turn the results into a budget.
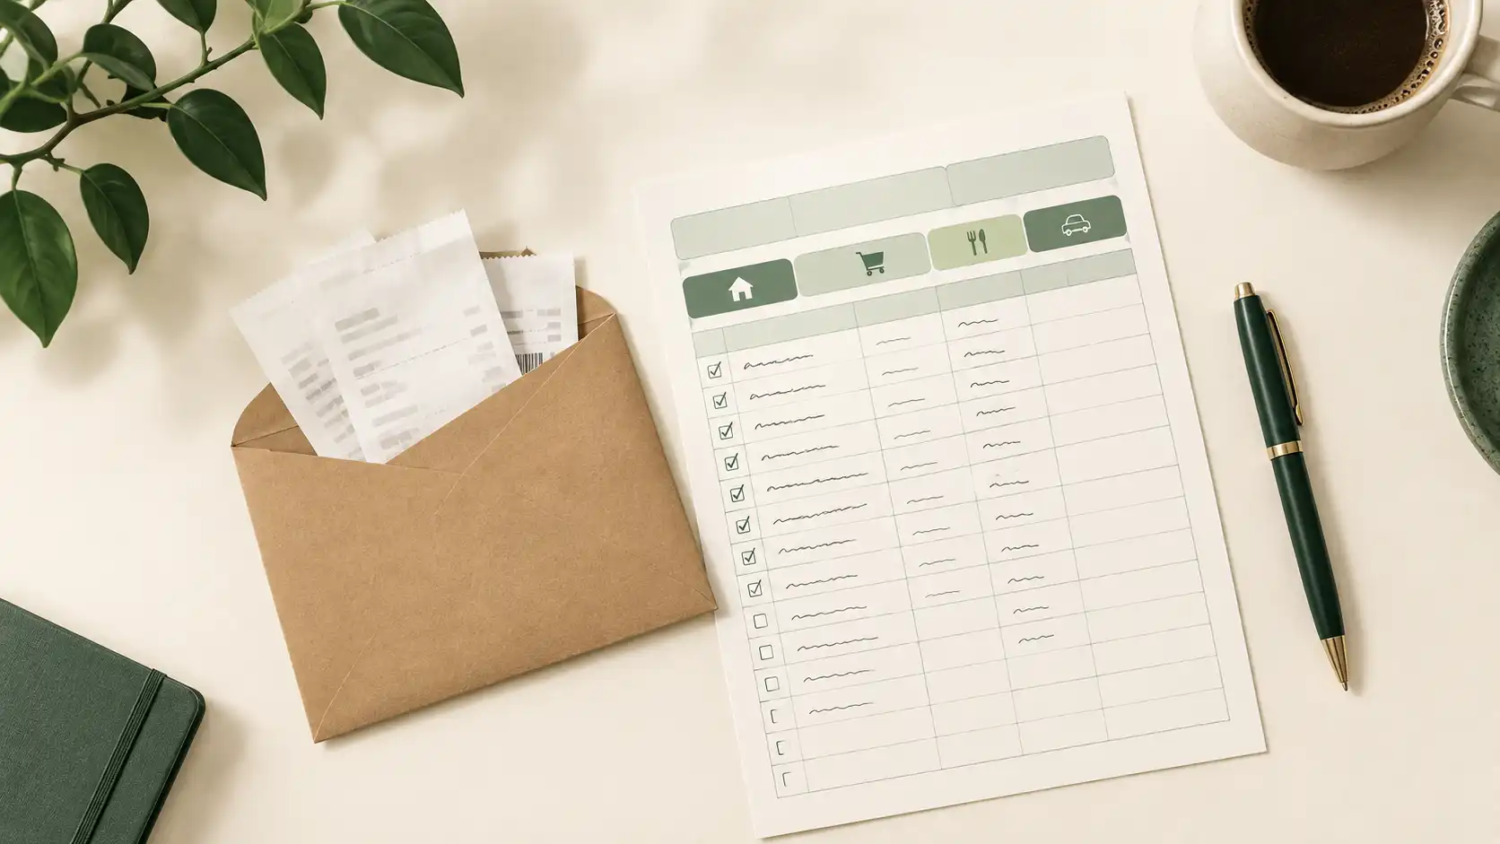
Quick Answer: For 30 days, record every purchase and bill on the day it happens, with the date, item, category, amount, and how it was paid. Keep receipts in an envelope as a backup. At the end of the month, total each category, separate spending that cannot be cut from spending that can be reduced or eliminated, and use the real numbers to build a budget. The goal of the first month is accuracy, not perfection or restriction.
Why a Full Month
The Consumer Financial Protection Bureau’s spending tracker tool, part of its Your Money, Your Goals toolkit, notes that many people who track their spending for a month discover they are spending money in small ways that add up and sometimes do not match their priorities. The tool suggests keeping an envelope for receipts and tracking a week or two if a full month feels too hard, though a month is best because it captures all of a household’s income and bills. A shorter stretch can miss the rent payment, a quarterly bill, or the weeks when spending clusters around payday.
There is also research behind the habit of tracking itself. A 2016 meta-analysis in Psychological Bulletin by Benjamin Harkin and colleagues, covering 138 randomized studies with nearly 20,000 participants, found that prompting people to monitor their progress toward a goal increased the chance of reaching it, with an average effect described as small to moderate. The effect was larger when progress was physically recorded and when it was reported to someone else. Most of those studies involved health goals such as diet and exercise rather than money, so the findings support the general principle of writing things down, not a specific result for spending.
Pick a Tracking Method
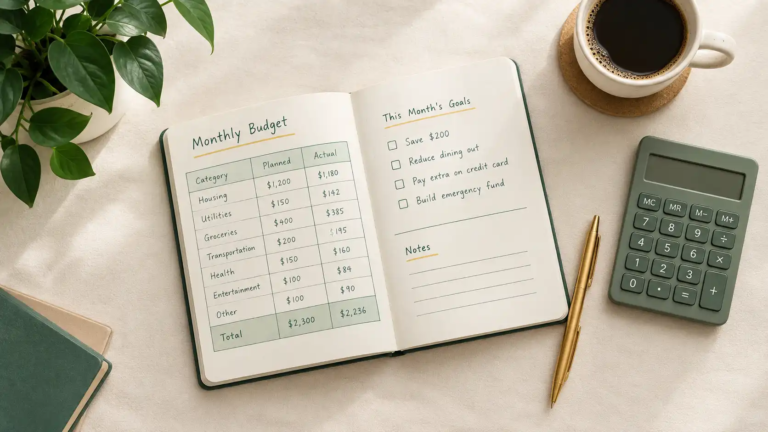
The method matters less than finishing the month. A paper sheet that gets filled in beats an app that gets abandoned in week two.
| Method | How It Works | Best For | Watch Out For |
|---|---|---|---|
| Paper tracker | Write each purchase on a printed sheet, with a receipts envelope as backup | People who like a physical record and want zero accounts or logins | Easy to forget to carry the sheet; needs manual totals |
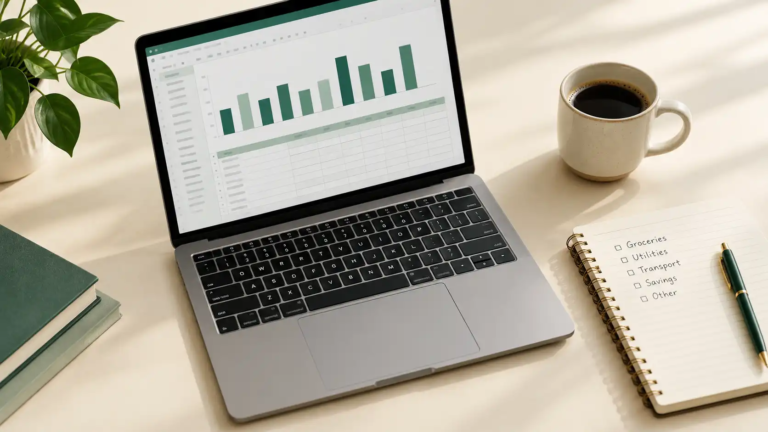
| Spreadsheet | Log each purchase in a sheet, with totals calculated automatically (see the budget spreadsheet guide ) | People comfortable with simple formulas who want automatic category totals | Requires opening the file regularly |
| Budgeting app | Enter purchases manually, or let a linked bank feed import them (see the free budgeting apps guide ) | People who want reminders and charts | Linking a bank shares account data; automatic categories can be wrong |
| Statements plus cash log | Review card and bank statements weekly and add a short log for cash purchases | People who mostly pay by card | Cash spending disappears unless it is logged |
How to Track Spending, Step by Step
1. Choose a Start Date and Categories
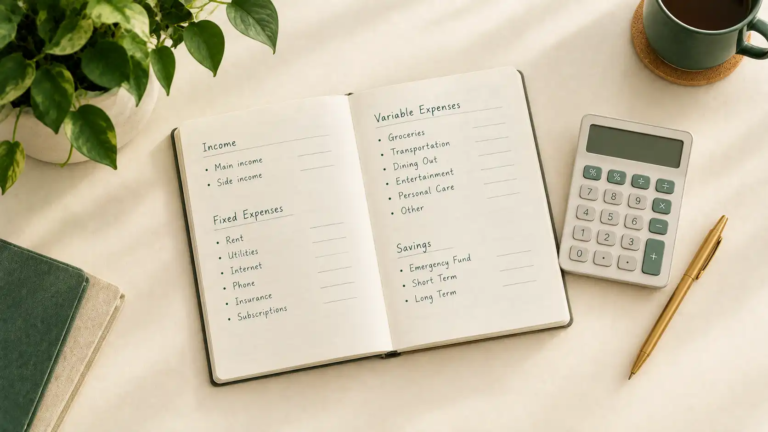
Start on a day that is easy to remember, such as the first of the month or a payday, and decide on 10 to 12 broad categories before beginning. The CFPB’s tool uses everyday groupings such as housing, food, transportation, cell phone, household items, and pets. Too many narrow categories make logging tedious; too few hide the details that matter.
2. Record Everything on the Day It Happens
Write down each purchase, including cash, small purchases, and automatic payments. Waiting until the weekend to remember the week is the most common reason a tracker has gaps. Putting receipts in one envelope, as the CFPB suggests, gives a backup for anything missed.
3. Include Recurring Bills and Subscriptions
Rent, insurance, phone, subscriptions, and loan minimums belong in the tracker even though they are automatic. These are often the largest numbers, and they show what a normal month costs before any discretionary spending.
4. Do a Five-Minute Check Each Week
Once a week, compare the tracker with bank and card statements to catch anything missing. A short weekly routine is easier than one long catch-up on day 30.
5. Total and Analyze on Day 30
Add up each category and the grand total. Then follow the CFPB’s analysis approach: separate spending that cannot be cut (rent, utilities, minimum payments), spending that can be reduced, and spending that can be eliminated. This sorting turns a list of numbers into decisions.
6. Turn the Numbers Into a Budget
The tracker’s totals become the starting point for a plan, using the household budgeting steps, a zero-based budget, or the 50/30/20 rule. The FTC’s guide to making a budget follows the same sequence of counting income, listing expenses, and then deciding on changes.
A Simple Printable Tracker
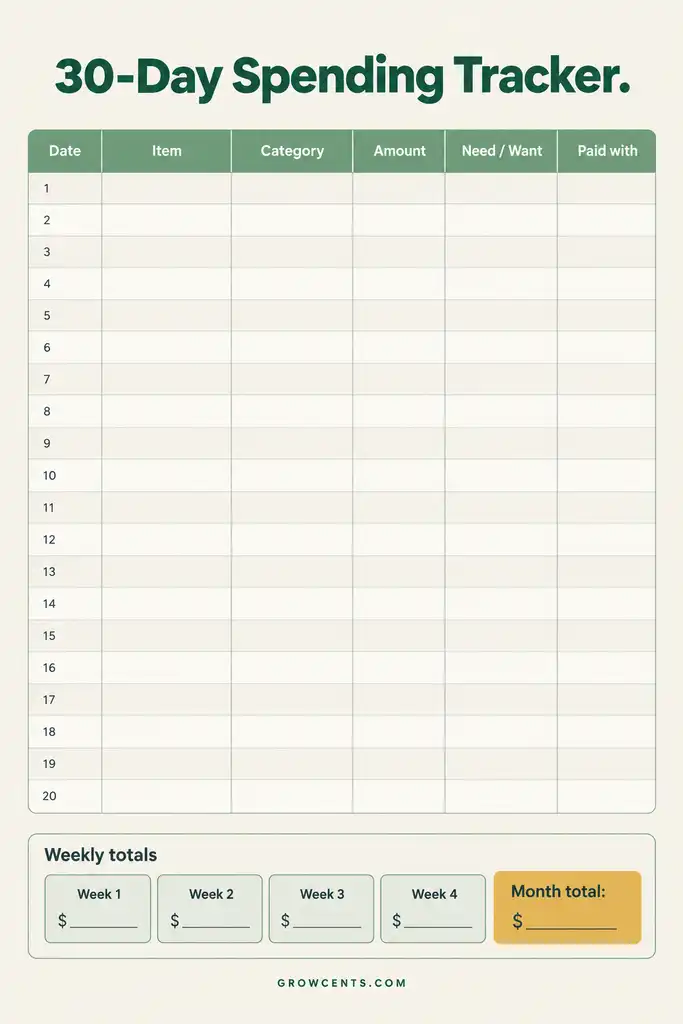
A single page with six columns is enough. The sample rows below show how entries look; the figures are illustrative.
| Date | Item | Category | Amount | Need or Want | Paid With |
|---|---|---|---|---|---|
| Oct 1 | Rent | Housing | $1,150.00 | Need | Bank transfer |
| Oct 1 | Coffee | Dining out | $4.50 | Want | Card |
| Oct 2 | Weekly groceries | Groceries | $108.30 | Need | Card |
| Oct 3 | Streaming service | Subscriptions | $11.99 | Want | Card |
| Oct 4 | Bus pass top-up | Transportation | $20.00 | Need | Cash |
A weekly summary box at the bottom of the page helps with the Sunday check:
| Week | Needs Total | Wants Total | Week Total | Notes |
|---|---|---|---|---|
| Week 1 | $____ | $____ | $____ | |
| Week 2 | $____ | $____ | $____ | |
| Week 3 | $____ | $____ | $____ | |
| Week 4 | $____ | $____ | $____ |
30-Day Spending Tracker — Printable Infographic
What a 30-Day Tracker Can Reveal: A Worked Example
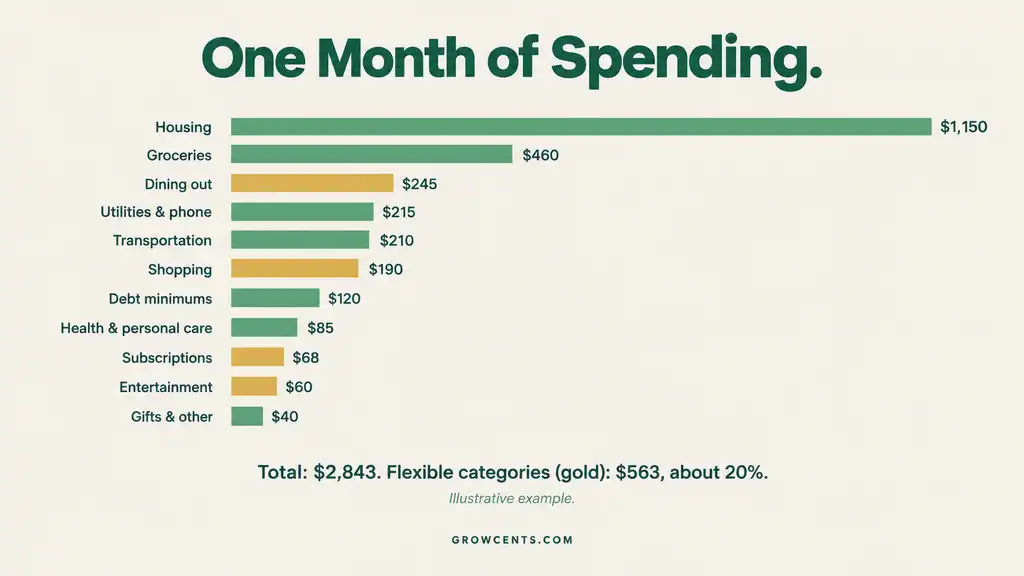
The table below shows one illustrative month for a household. The categories and amounts are examples built for this guide, not averages or benchmarks, and the percentages are rounded, so they may not add to exactly 100.
| Category | 30-Day Total | Share of Spending |
|---|---|---|
| Housing (rent, renters insurance) | $1,150 | 40.5% |
| Utilities, phone, and internet | $215 | 7.6% |
| Groceries | $460 | 16.2% |
| Dining out and takeout | $245 | 8.6% |
| Transportation | $210 | 7.4% |
| Subscriptions and memberships | $68 | 2.4% |
| Shopping | $190 | 6.7% |
| Health and personal care | $85 | 3.0% |
| Entertainment | $60 | 2.1% |
| Debt minimums | $120 | 4.2% |
| Gifts and other | $40 | 1.4% |
| Total | $2,843 | 100% |
Two patterns stand out. Dining out and takeout came to $245, about 53% as much as groceries ($460), which is the kind of gap that is easy to miss without a record. And the four most flexible categories (dining out, subscriptions, shopping, and entertainment) added up to $563, about 20% of the month’s spending. Those are the categories most open to adjustment, while housing, utilities, and debt minimums are largely fixed. None of this says what the household should do; it simply replaces a guess with a number.
One Month, Eleven Categories — Infographic
Making It Easier to Finish
- Treat the first month as observation, not judgment. Many people find they track more honestly when the goal is to record, not to cut.
- Attach logging to an existing routine. Filling in the sheet while brushing teeth or at dinner gives the habit a reliable cue, an idea explored in the $5 savings challenge guide.
- Keep the receipts envelope in one place. A bag, a wallet slot, or a drawer works, as long as it is always the same spot.
- Use a shortcut for small purchases. A phone note with the amount and category is enough, and it can be copied to the sheet later.
- Do not restart after a missed day. A gap can be filled from the statement or receipts, and the month can continue.
- Protect personal information. The CFPB’s toolkit recommends keeping names and account numbers off these worksheets, and anyone using a mobile app should read the privacy points in the budgeting apps guide before linking accounts.
After Day 30: What to Do With the Numbers
- Sort every category into three groups. Spending that cannot be cut, spending that can be reduced, and spending that can be eliminated, following the CFPB’s analysis worksheet.
- Set one new target per flexible category. Small, realistic targets work better than large ones.
- Add the irregular costs the month missed. Annual and seasonal expenses belong in a sinking fund tracker.
- Direct part of the savings. Money freed up in one category can go toward a starter emergency fund, ideally through an automatic transfer.
- Repeat in three months. A second, shorter tracking period shows whether the changes held.
Common Mistakes
- Skipping cash. Small cash purchases are the first to vanish from a record.
- Tracking only the “bad” spending. A complete tracker includes bills and necessities, because the total is what makes the picture accurate.
- Waiting days to log. Memory is unreliable after a few days, and entries become estimates.
- Using too many categories. Thirty categories is more than most people will maintain.
- Quitting after one messy week. Even an incomplete month tells more than no record.
- Never reviewing the results. Tracking without an end-of-month review is just record keeping.
Frequently Asked Questions
Do I really need 30 days?
A month is best because it captures all of a household’s regular bills along with day-to-day spending. The CFPB’s tool suggests that a week or two is a reasonable fallback if a full month feels like too much.
Should I change my spending during the month?
It is not required. Many people simply record the first month as it is, then decide what to change using the data. If spending changes naturally because of the tracking, that is fine, but the first goal is an accurate picture.
How should irregular income be handled?
Track spending the same way. Pairing the results with the baseline method in the guide to budgeting on variable income turns the tracker into a plan.
What about shared household spending?
Couples can track jointly, or each person can track personal spending while shared bills are logged once. The couples budgeting guide covers structures that work for shared accounts.
Is an app better than paper?
Neither is better in general. Paper keeps everything private and requires no accounts; an app adds convenience and charts. The best tool is the one that actually gets used every day.
How This Guide Was Built
This guide was researched using government consumer education materials and published research rather than personal anecdote or invented statistics. The month-long approach, receipts envelope, and three-way analysis of spending come from the Consumer Financial Protection Bureau’s spending tracker tool. The research on monitoring and goal attainment comes from the Harkin et al. 2016 meta-analysis in Psychological Bulletin, whose studies were mostly about health goals rather than money. Budget-building steps reference the FTC’s consumer.gov budgeting guide. The sample tracker rows and the $2,843 month are illustrations built for this guide, calculated directly and not sourced data. GrowCents’ full research and sourcing approach is described on the Editorial Policy page and the About page.
This article is general educational information, not personalized financial advice, and does not account for any individual household’s full financial situation. See the Disclaimer page for details.